Retailer Summary
Our flagship dashboard for visualizing share changes across retailers - use this dashboard to understand channel dynamics and how they change year over year and period over period.
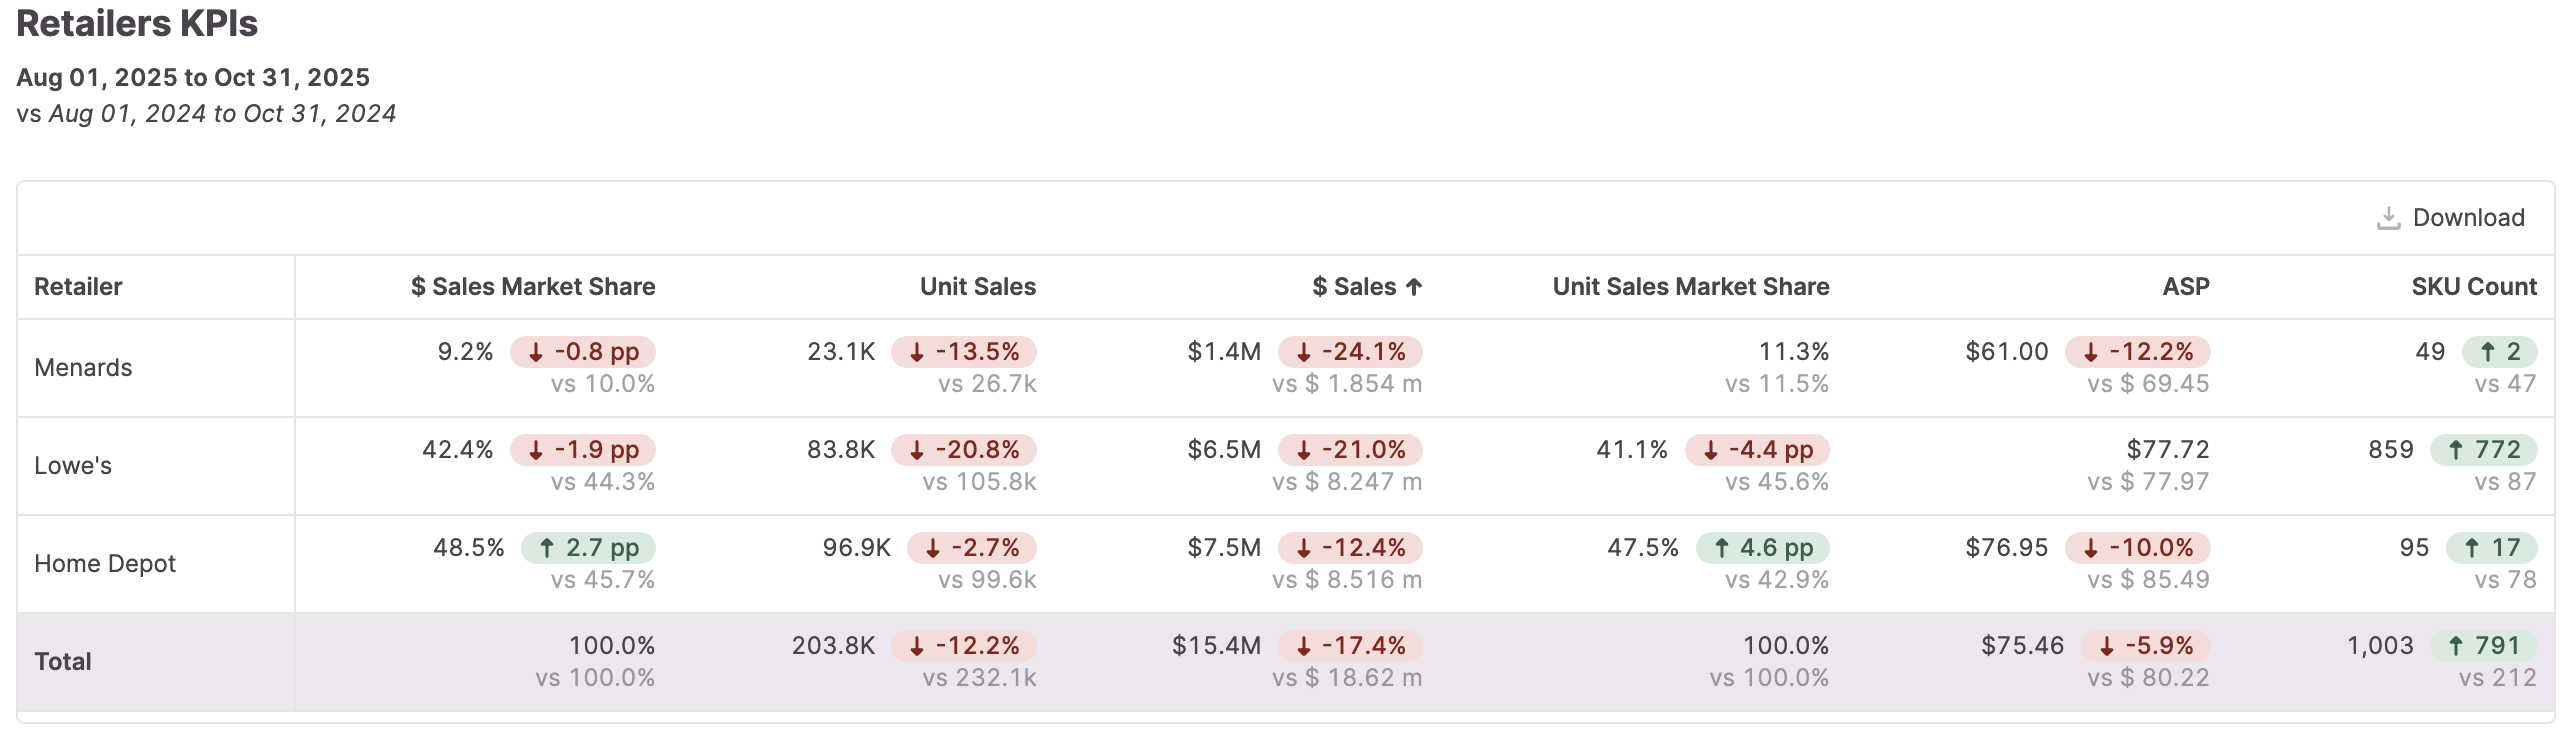
Retailer Summary Basics
How to Read
This table presents a holistic, cross-retailer view of the market. Each retailer metric is compared to historic performance, showcasing how that retailer's performance has changed over time.
How to Use
Customize the comparison timeline (e.g. YoY, MoM, etc) and the geographic region (e.g. only GA, all of Southwest, etc) to identify actionable growth trends for your categories. Operate with full visibility by looking at complete category performance for a retailer, and compare it across key competing retailers.
Key Metrics
$ Sales Market Share
Market share based on total sales value.
Unit Sales Market Share
Market share based on total units sold.
ASP
The average selling price of an item or group of items.
Methodology: ASP = $ Sales / Units Sold