Geo Summary & Optimizer
Provides a Geographic performance breakdown, highlighting location-based insights using easily digestible tables and interactive heat maps. Use this dashboard to find regional opportunities and compare competitive performance across states.
Geo Summary & Optimizer Basics
How to Read
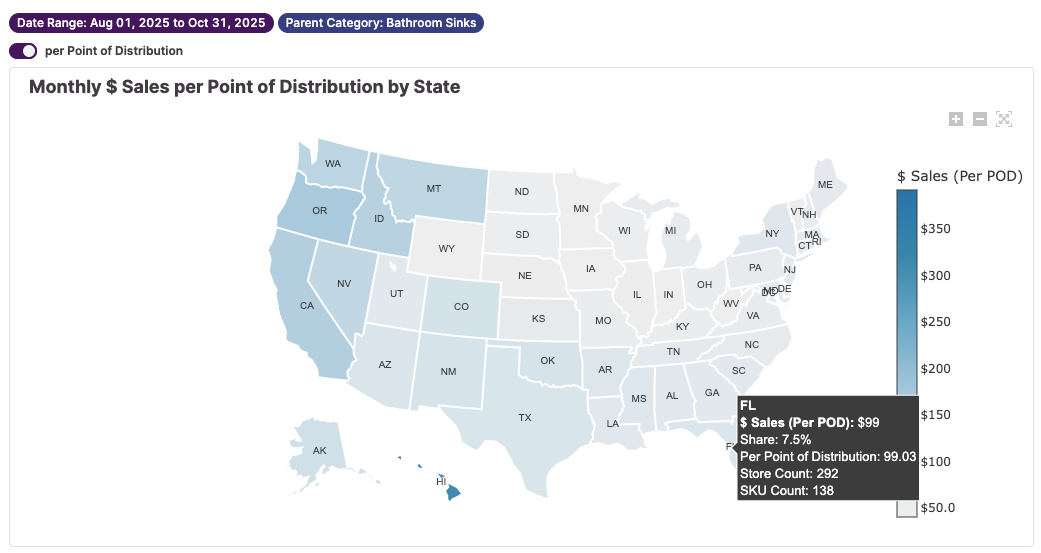
The Geo Summary tab shows how the total sales and sales per point of distribution vary by state and by geographic region (e.g. Southwest, Northeast, etc). The Geo Optimizer tab highlights lagging states with opportunities to improve. It shows where a brand's state-level market share is lower than the brand's Nationwide Category Share. It also calculates the revenue uplift of raising the state-level market share to the brand's Nationwide Category Share.
How to Use
After filtering for your brands, use the Geo Summary to understand what states and regions are driving your sales. Then switch to the Geo Optimizer to find where you’re relatively underperforming and where there are opportunities for expansion.
Key Metrics
Point of Distribution
A metric used to measure placement. It is a count of distinct store-and-SKU combinations for a given category, brand, retailer, etc.
Nationwide Category Share
The percent of the nationwide, category-specific market owned by a given brand
Methodology: $ Brand Sales / Total $ Sales
State Share
The percent of the statewide, category-specific market owned by a given brand
Methodology: $ Brand Sales / Total State $ Sales
Stores in State Within Category
The number of stores within a given state that are carrying items within a given category.
Stores with Brand & Category Coverage
Given the number of "Stores in State Within Category", what percentage of them are carrying items of a given brand.