Business Summary
Provides detail on how inventory, price and assortment changes drive market shifts. This dashboard will guide you to the best optimization tool to sharpen your insights further.
Business Summary Basics
How to Read
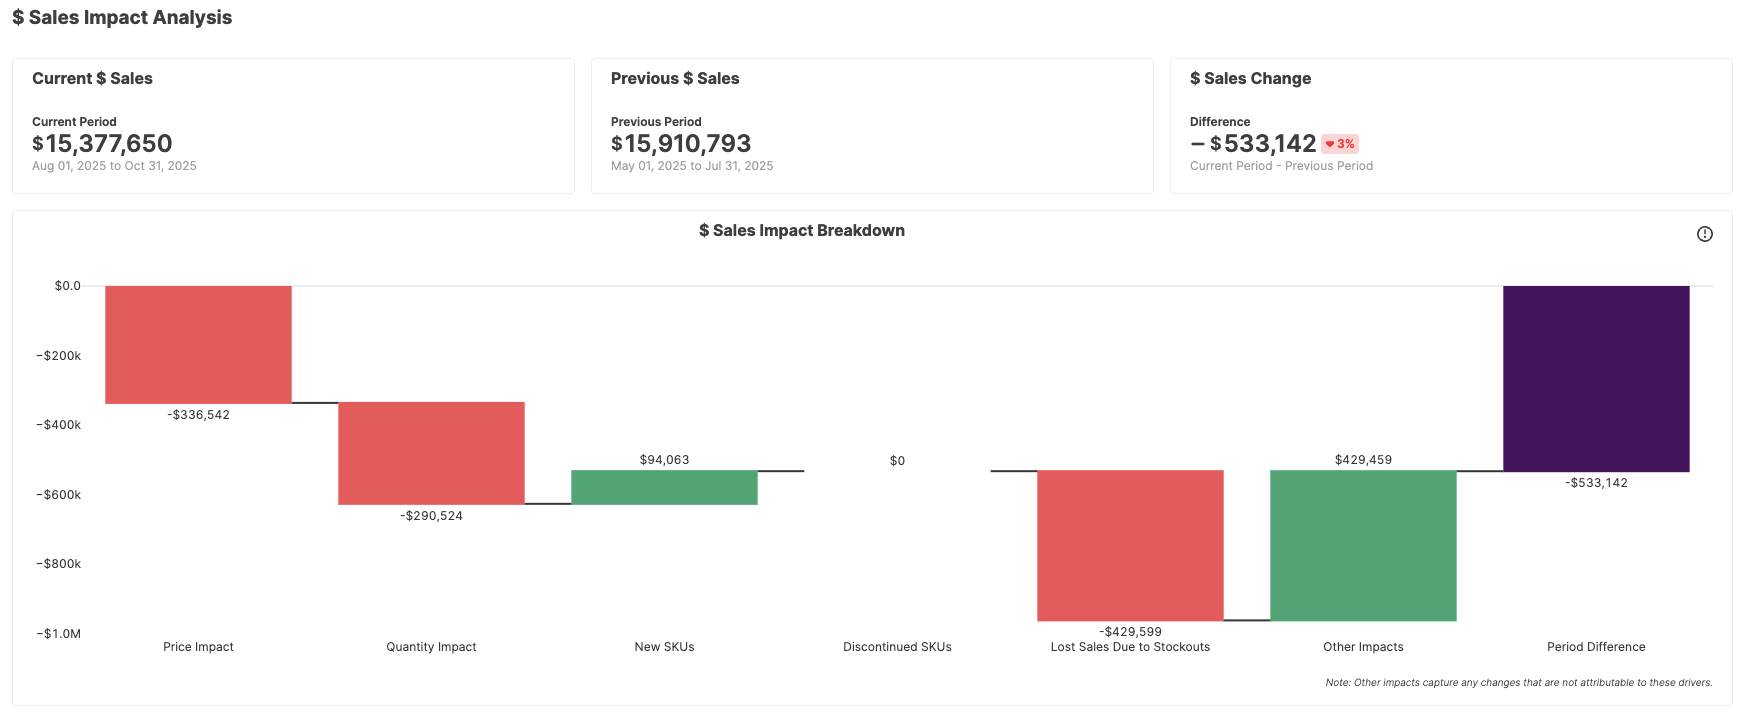
This waterfall chart shows how item price, units sold, new items, deprecated items, and stockouts affect overall value sold. The impact of each of these categories is compared to the prior time period (last month, last year, last quarter, etc).
How to Use
This chart illuminates why sales may be up or down for a given time period by breaking down total sales down into distinct factors. By filtering for categories, brands, or regions relevant to your business you can identify what factors (price changes, lost sales due to stockouts, etc) are essential to your growth.
Key Metrics
Price Impact
Quantifies the impact of item price on $ sales (only includes items present in both comparison periods) and normalizes for the impact of changes in price that comes from assortment changes
Quantity Impact
Measures how much units sold changes affected total sales amount (controlling for price)
New SKUs
The sales impact from products that were not present in the previous time period.
Discontinued SKUs
The negative sales impact from products not present in the current time period that were present in the previous time period
Lost Sales Due to Stock outs
Estimates sales value lost due to being out of stock.
Other Impacts
Captures any changes that are not attributable to any of the above drivers.
ASP
The average selling price of an item
Methodology: ASP = $ Sales / Units Sold
Median ASP
The median ASP of a group of items