Assortment Gaps
Quantify the value of expanding your product placement to new stores and confidently make your case for adding your product to a given retailers' assortment and geographic region.
Assortment Gaps Basics
How to Read
This dashboard is designed to quantify the opportunity of your assortment strategy. It will help you find the largest opportunities of growth in your category, at the brand, attribute and product level as your assortment decisions shape the market.
How to Use
Focus on high-value opportunities at the attribute level. Use this data to quantify the business case for adding your introducing a new product with a given feature to the market and estimate the impact of adding this item on the retailer, category, and your brand
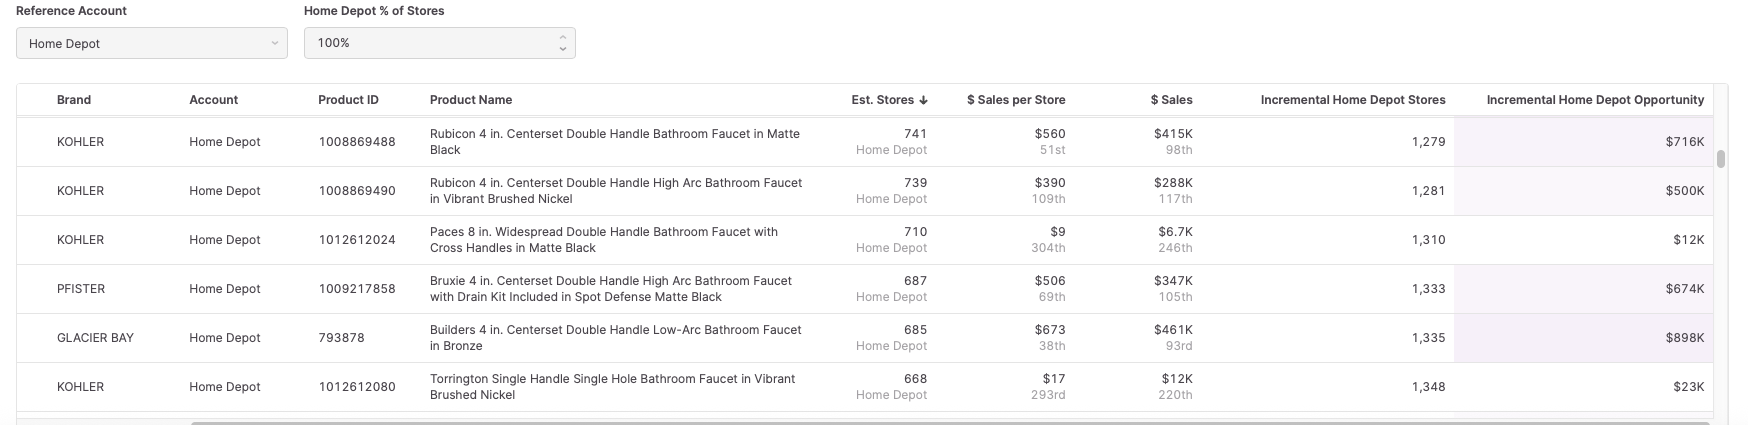
Key Metrics
Reference Market Share
Your target to reach at the given level of granularity (retailer, brand, category, attribute, product)
Incremental Opportunity
Estimated revenue potential in the following year from increasing your current share to the Reference Market Share.
Methodology: Reference Market Share * Current $ Sales / Current $ Share
Case Studies
Recommended Next Steps
Geo Summary & Optimizer
Dive deeper into regional performance to understand why certain geographic areas show distribution gaps.
Assortment Summary
See how closing these gaps would improve your overall assortment health and competitive positioning.
Attribute Trends
Understand which product attributes are most valuable in gap stores to prioritize which SKUs to expand.