Assortment Summary
Win incremental stores by proving your SKUs are more efficient than your competitors'. Learn from the top and bottom-performing SKUs to make assortment recommendations with the entire category in mind.
Assortment Summary Basics
How to Read
This dashboard provides a comprehensive overview of your product assortment health. View side-by-side comparisons of your brand vs. competitors across key performance indicators, with visual breakdowns by category, brand, and retailer.
How to Use
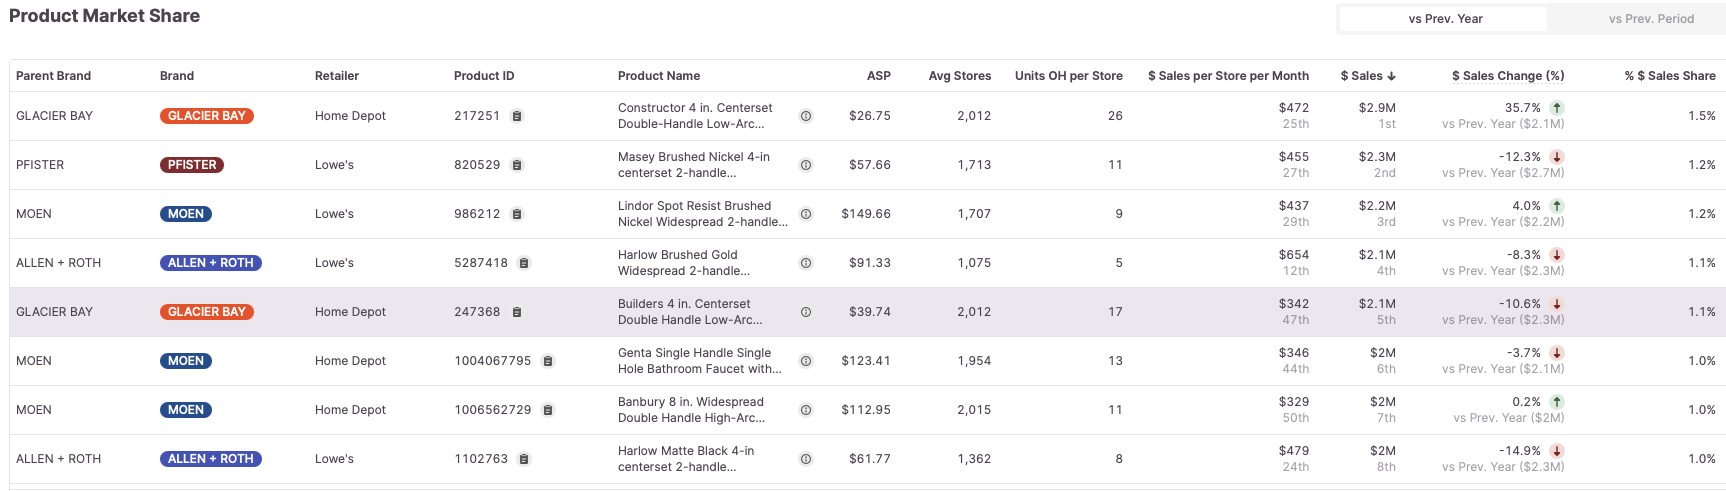
Use the brand share chart to identify which competitors are driving category growth, and the table below to surface the products fueling their success. Use these insights to inform your product development and PLR strategies.
Key Metrics
ASP
The Average Sale Price for the item across the time period
Methodology: $ Sales / Unit Sales
Avg Stores
The Average Number of Stores that stock this item during the time period
$ Sales per Store per Month/Week
Allows for comparing efficiency between items by normalizing for the number of stores and the number of weeks the item is in stock.
Methodology: (Item $ Sales / Avg Stores / # of Weeks/Months item is Available)
Case Studies
Recommended Next Steps
Attribute Trends
Identify specific product attributes driving category growth to guide your product development roadmap.
SKU Rationalization
After understanding your assortment gaps, use this tool to optimize your SKU mix and build compelling PLR arguments.
Assortment Gaps
Quantify the revenue opportunity from expanding your distribution to more stores and retailers.