Category & Brand Summary
Breaks down category and brand share shifts in an easily digestible table that highlights year over year changes across categories and brands.
Category & Brand Summary Basics
How to Read
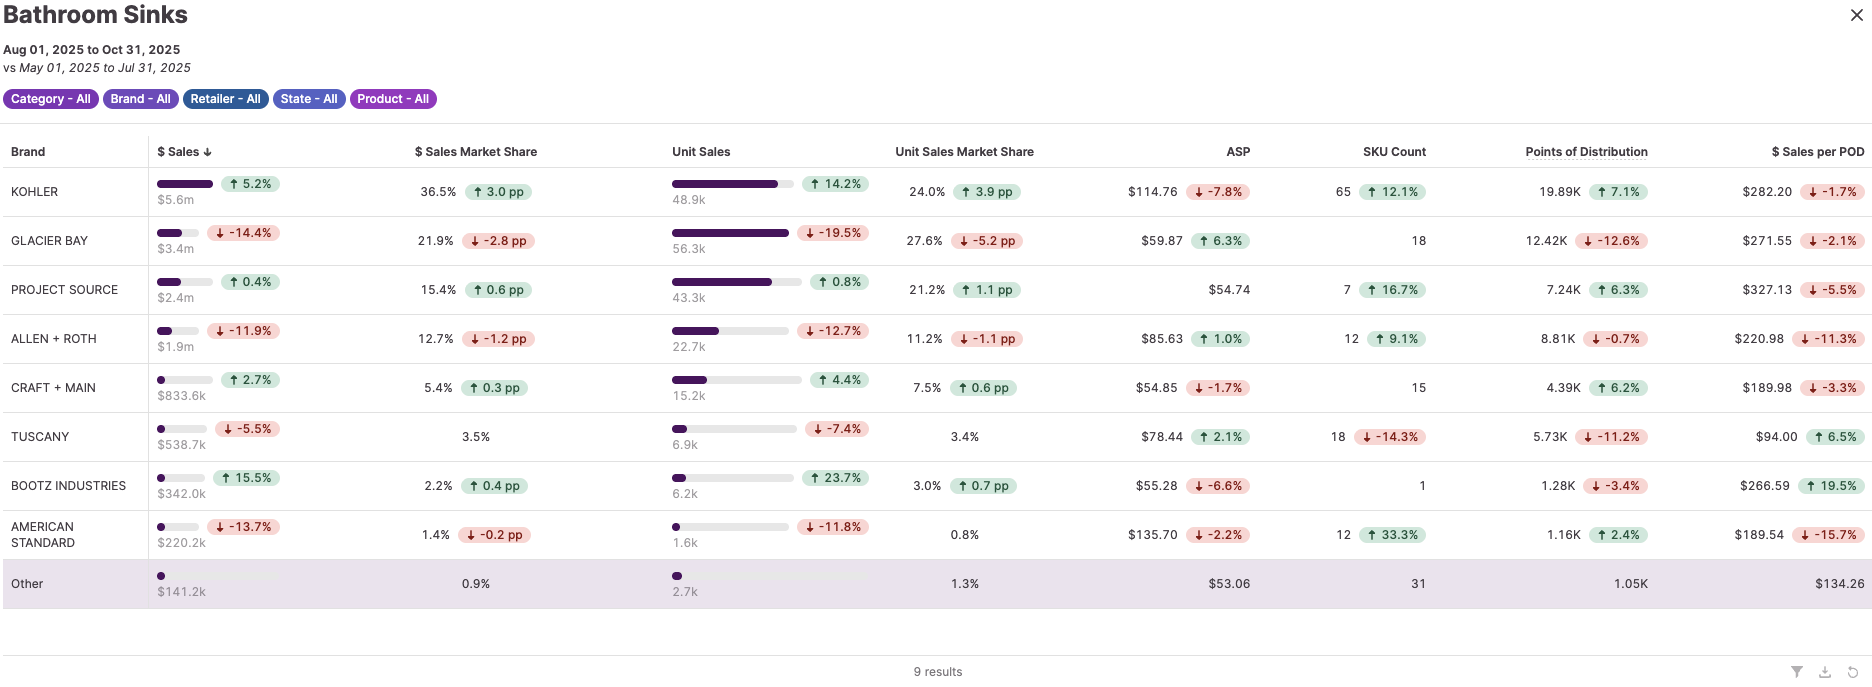
This table allows you to drill down into parent category performance, either by brand or by category. It illustrates which brands (or categories) are driving parent-category sales and potential causational KPIs, such as price and placement.
How to Use
Identify what categories or brands are driving overall sales, and what KPIs are the root causes: ASP: price impact, SKU count: assortment impact, Points of distribution (POD): placement impact, Sales per POD: efficiency impact
Key Metrics
ASP
The average selling price of a category or brand
Methodology: ASP = $ Sales / Units Sold
Points of Distribution
A metric used to measure placement. It is a count of distinct store-and-SKU combinations for a given category, brand, retailer, etc.
$ Sales per POD
The sales of a given category or brand per Point of Distribution.
Methodology: $ Sales / Points of Distribution