Price Summary
Determine what the right price is for your products.
Price Summary Basics
How to Read
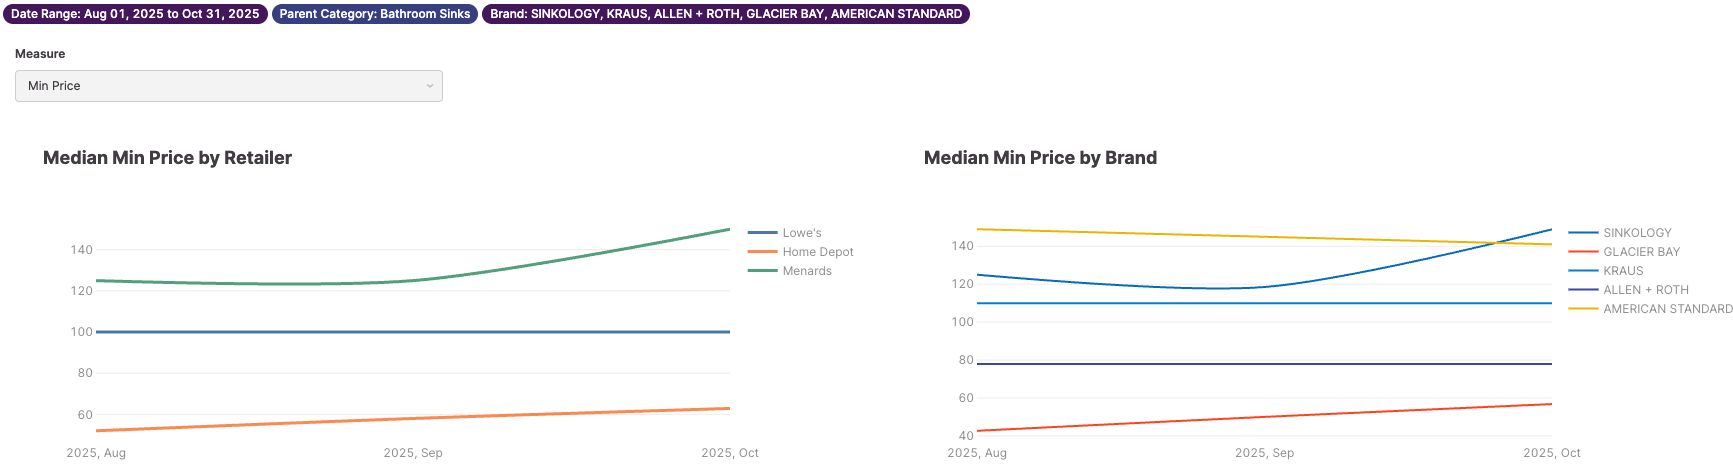
This dashboard shows retail, brand, and SKU-level price movements in the market. Compare market trends across different price metrics (ASP, min price, etc). The top half will allow you to see brand-level trends, then you can adjust filters to find examples of specific competitive SKUs that have moved prices.
How to Use
Understand how your pricing strategy aligns or misaligns with broader market trends across brands and retailers, and determine whether it relates to sales mix or price changes. Customize the region, category, and time period filters to explore the pricing strategies of your competitors' brands. Then, identify which individual items are driving the macro trends. This will give you the ground truth about how your retailer and its competitive retailers are pricing your competitive brands.
Key Metrics
Min Price
The lowest retail sale price (including promotions) across all stores
Max Price
The highest retail sale price (excluding promotions) across all stores
ASP
The average selling price of an item or group of items
Methodology: ASP = $ Sales / Units Sold
Median Sale Price
The median retail sale price (including promotions) across all stores
Median Base Price
The median retail sale price (excluding promotions) across all stores
Flagship Min Price
The price at the "flagship store" for each retailer (including promotions)
Flagship Max Price
The price at the "flagship store" for each retailer (excluding promotions)