SKU Comparison
Replace competitive SKUs with your better-performing SKUs by showing the merchant that you perform better than the benchmark average.
SKU Comparison Basics
How to Read
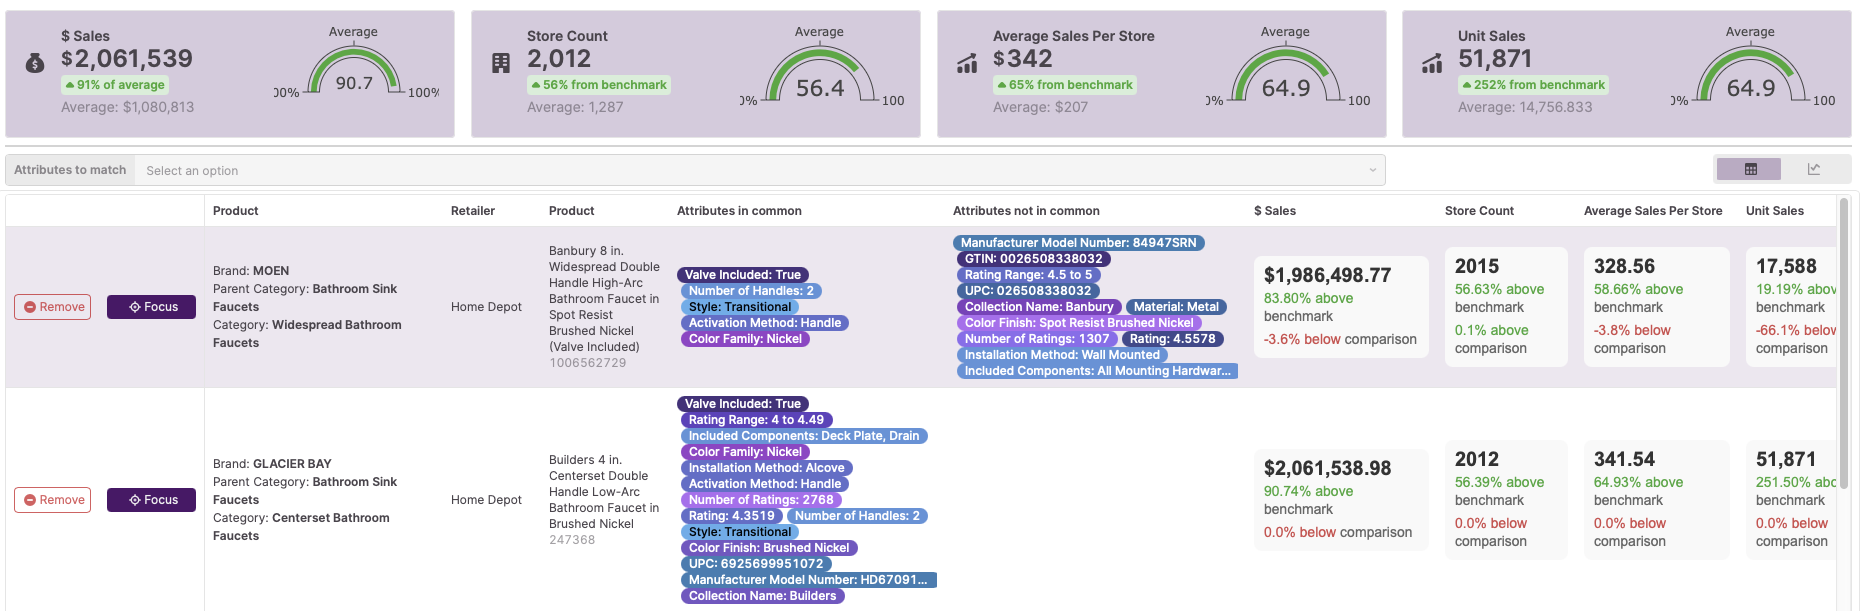
Create custom groups of comparable SKUs and view side-by-side performance metrics using product features. Each product is displayed with key indicators like price, distribution, and market share, making it easy to spot winners and losers in similar product segments.
How to Use
Identify which like-for-like SKUs outperform on key metrics and why. Use these insights to make specific product recommendations in PLRs, showing clear performance advantages of your products over competitors.
Key Metrics
Store Count
Average Number of Stores with inventory of this product or group of products
$ Sales per Store per Month/Week
Allows for comparing efficiency between items by normalizing for the number of stores and the number of weeks the item is in stock.
Methodology: (Item $ Sales / Avg Stores / # of Weeks/Months item is Available)
Unit Sales, $ Sales, Store Count and Price Benchmarks
The average values of each metric across the your selection of comparison SKUs
Recommended Next Steps
SKU Rationalization
After comparing products, use this tool to build arguments for swapping underperformers with your higher-performing SKUs.
Attribute Trends
Understand which product attributes drive performance differences between compared SKUs.
Price Distribution
See how your SKUs' price points compare to the broader category price distribution.