Price Distribution
Create flexible price groups to visualize how each price group contributes to a retailers' performance and identify price driven assortment opportunities to surface in your next PLR.
Price Distribution Basics
How to Read
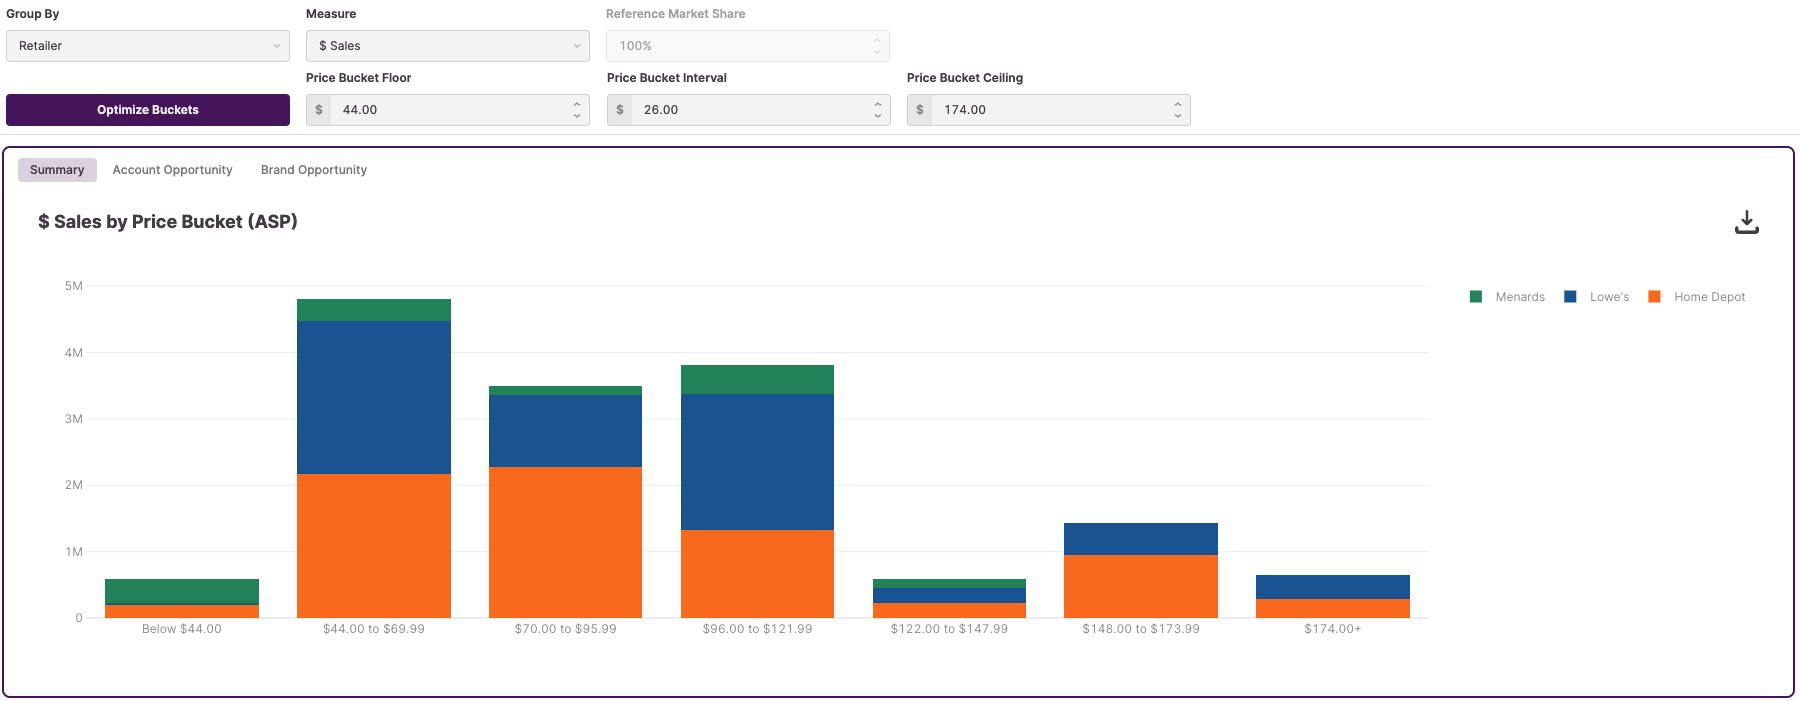
Price Distribution shows how overall sales are distributed amongst price buckets. These buckets are segmented by retailer, category, or brand. This dashboard illustrates who the major players are in each price tier of the overall market and where potential gaps are among the key players.
How to Use
Use "Summary" to identify gaps in retailers' assortment and price strategies to help your brand or merchant catch up with their competitors. Use the "Account Opportunity" and "Brand Opportunity" tabs to identify under-supplied price buckets (e.g., low SKU count but with high total sales) and pinpoint the easiest opportunities to grow your retailer and brand market share.
Key Metrics
ASP
The average selling price of an item or group of items
Methodology: ASP = $ Sales / Units Sold
Incremental Opportunity
Shows the $ Sales green space available for a given category and price bucket.
Methodology: (100 * Total Sales / % Sales) - Total Sales