Price Impact
After using our Price Summary dashboard to find periods of dynamic change, use Price Impact to quantify the effect of those price changes. Which brands or retailers won share during this period, which lost, and what items are driving those gains and losses?
Price Impact Basics
How to Read
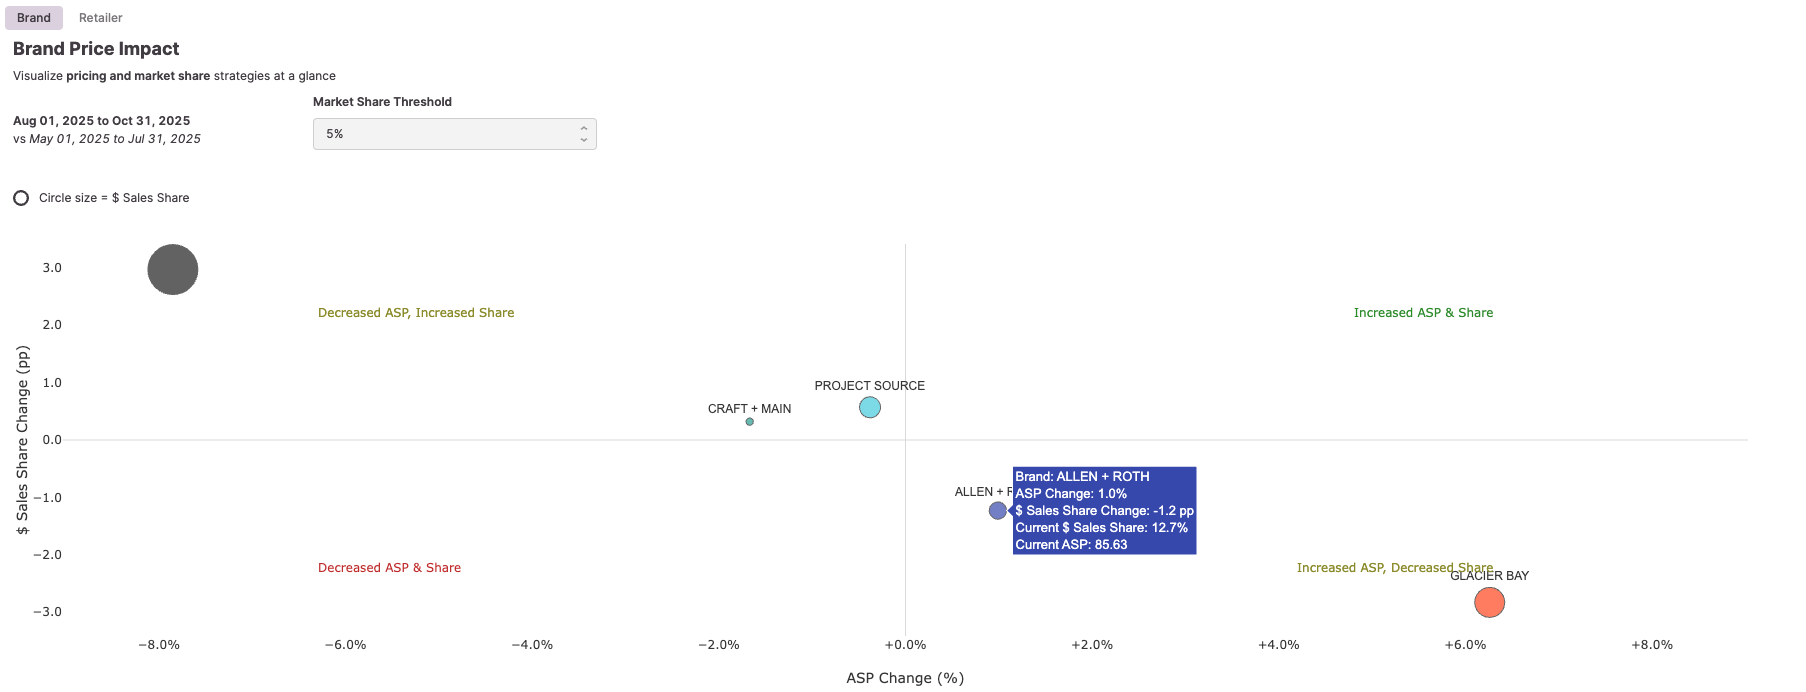
This four quadrant graph shows how recent brand or retailer pricing strategies have affected market share. The four quadrants illustrate which brands or retailers increased or decreased their price, and consequently increased or decreased their market share.
How to Use
Take charge by reviewing proprietary information on which pricing strategies are working and which are not for your competition. If a new price point is winning, make sure you adopt it. If a new price point is hurting your competition, use that information to your advantage by avoiding pitfalls. Customize the time period and region filters to identify pricing strategy trends in your key markets. Create a win-win for you and your retail customers by analyzing what pricing strategy is winning market share at retail. From there, suggest new SKUs from your assortment that match the trends, or suggest new price points for your SKUs with placement.
Key Metrics
Average Sale Price (ASP)
The average selling price of an item or group of items
Methodology: $ Sales / Unit Sales
ASP Change
The percent difference of ASP between the two given time periods