Assortment PLR Playbook
This Product Line Review workflow guides you through the process of building data-driven assortment recommendations to boost your merchants' GMROI. Follow these 5 steps to leverage sales efficiency metrics to help your merchant swap our inefficient SKUs for more efficient ones, or keep efficient SKUs on the shelf, and prevent them from making a mistake.
Download Full Playbook Deck (PDF)Workflow Steps
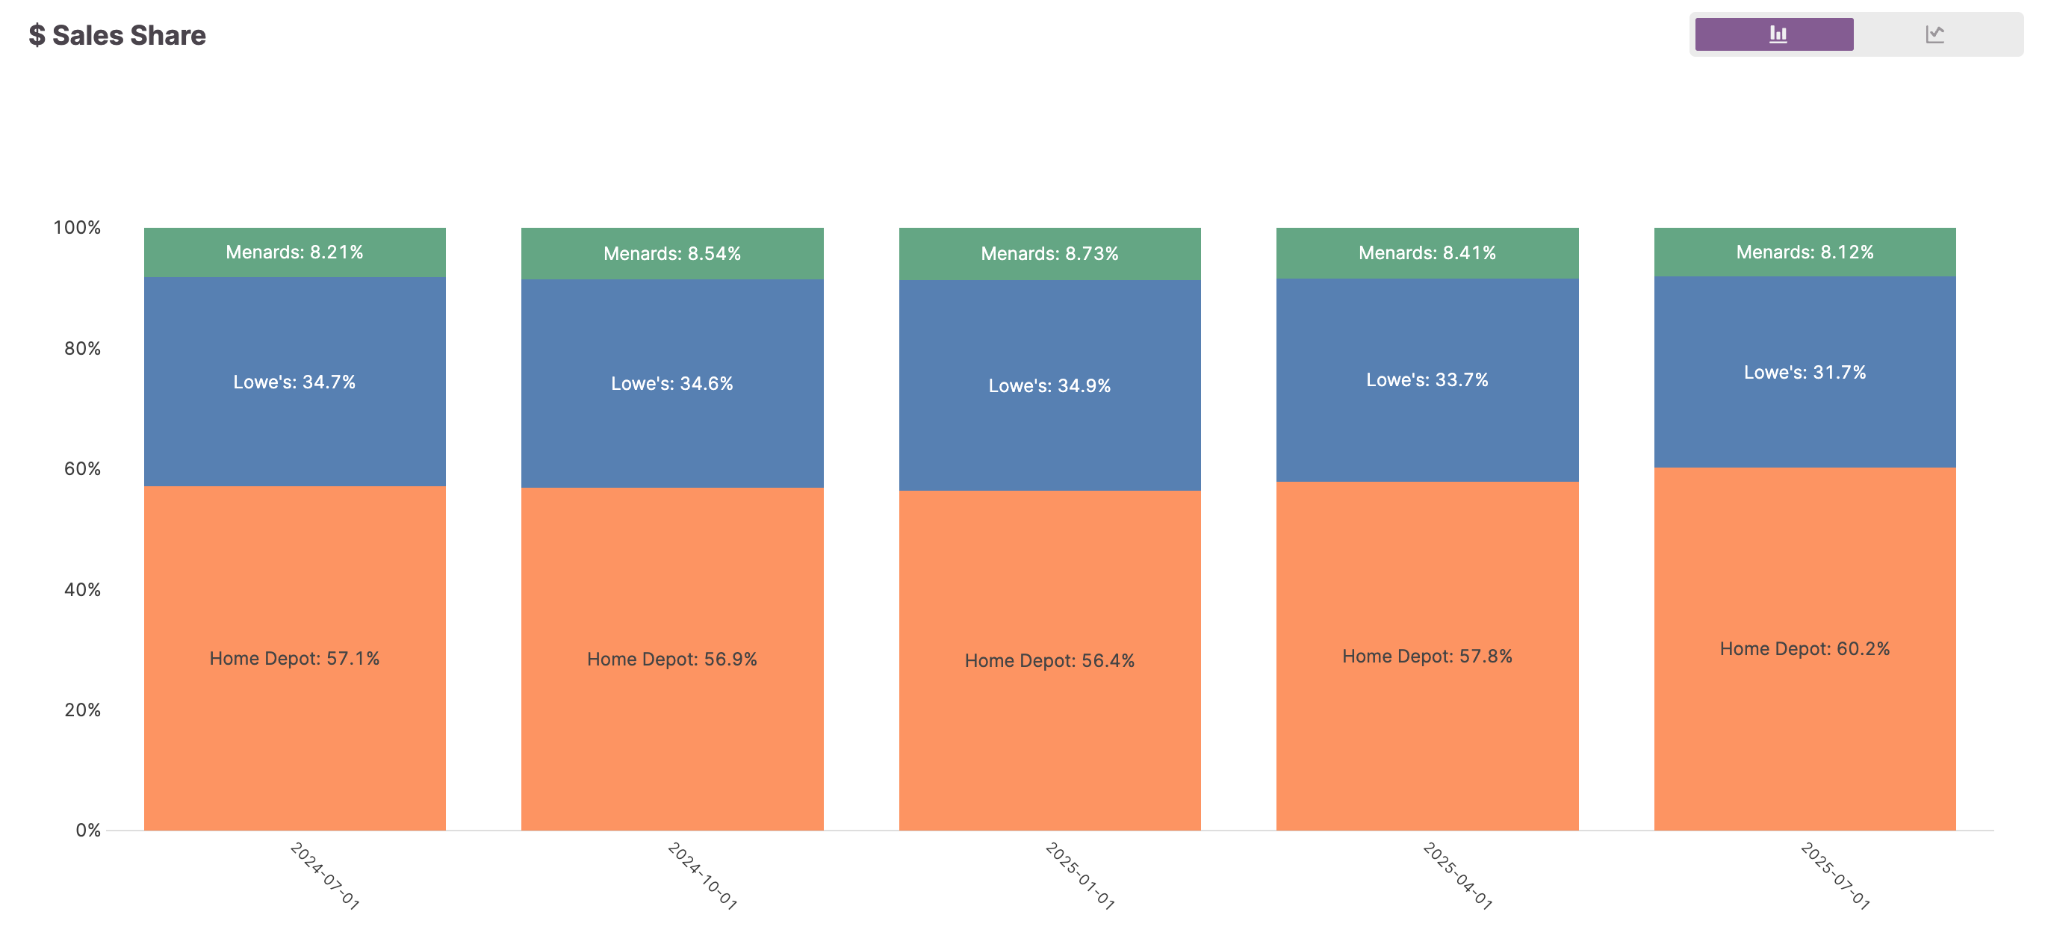
Retailer Share
Start by analyzing market share trends across retailers to identify which retail partners are gaining or losing share. In this example, we see that Home Depot has won 3% Share from Q3 2024 - Q3 2025.
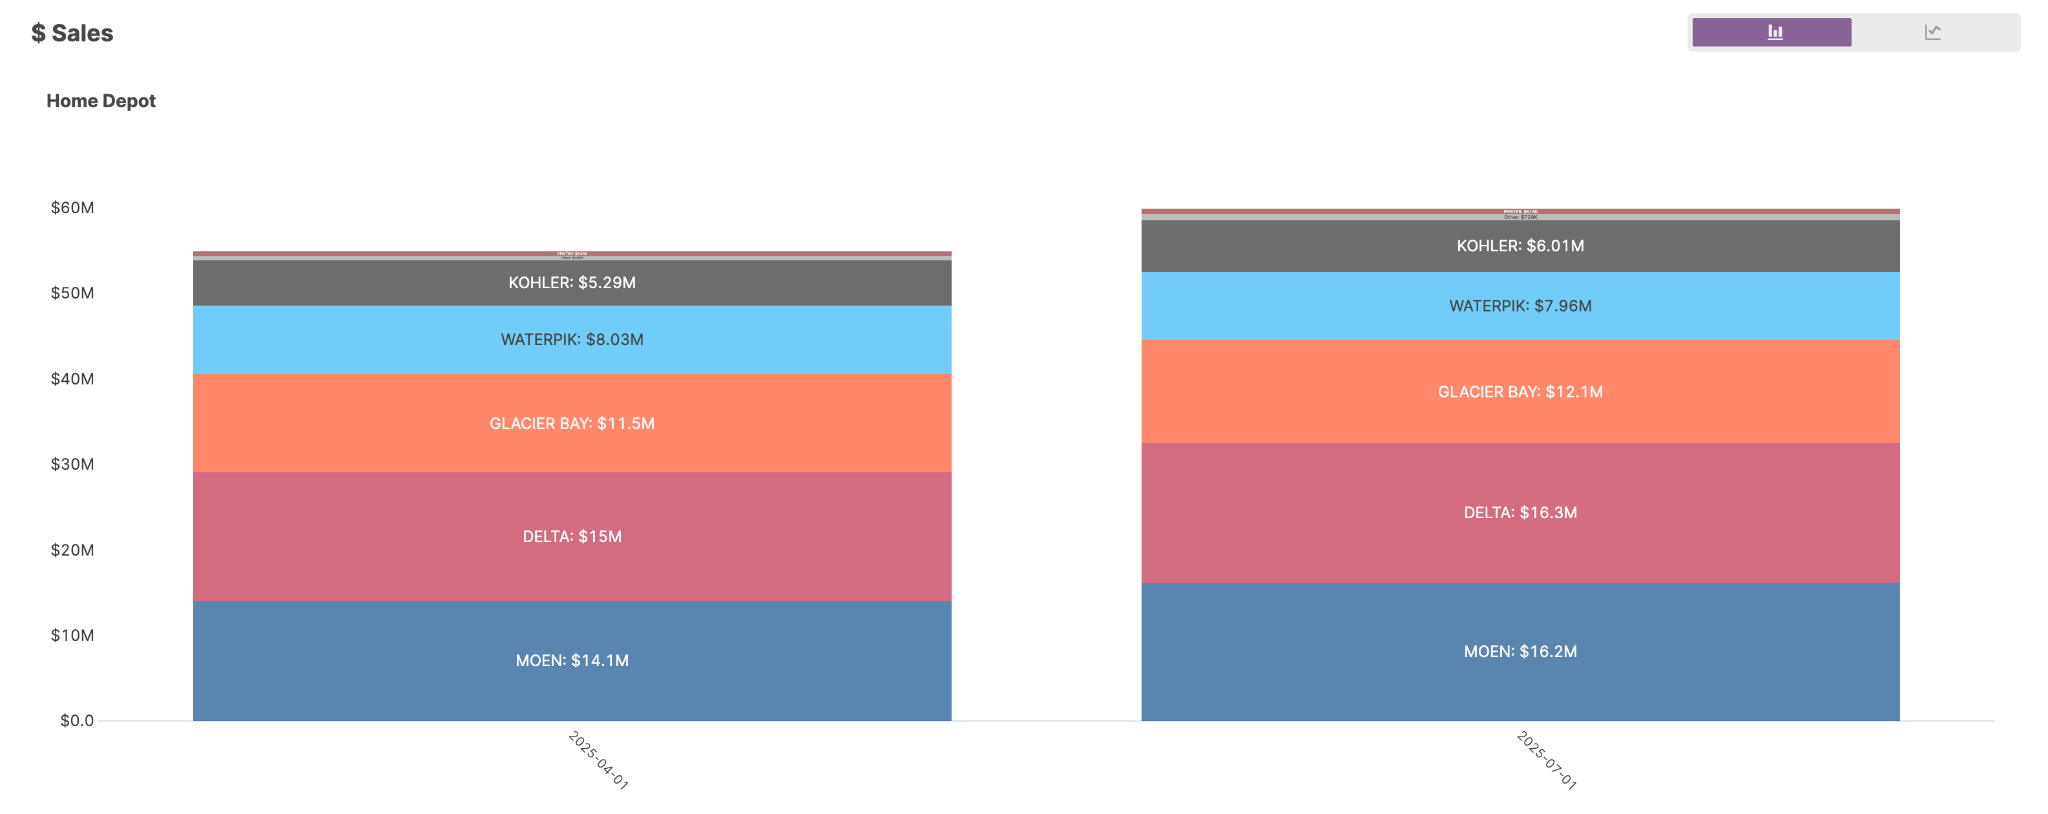
Brand Share
Dive deeper into brand-level performance to understand which brands are driving category growth or decline for a particular retailer. Quarter over quarter, Moen grew the most of Home Depot's suppliers in Q3, which represents the best quarter for the retailer in 15 months.
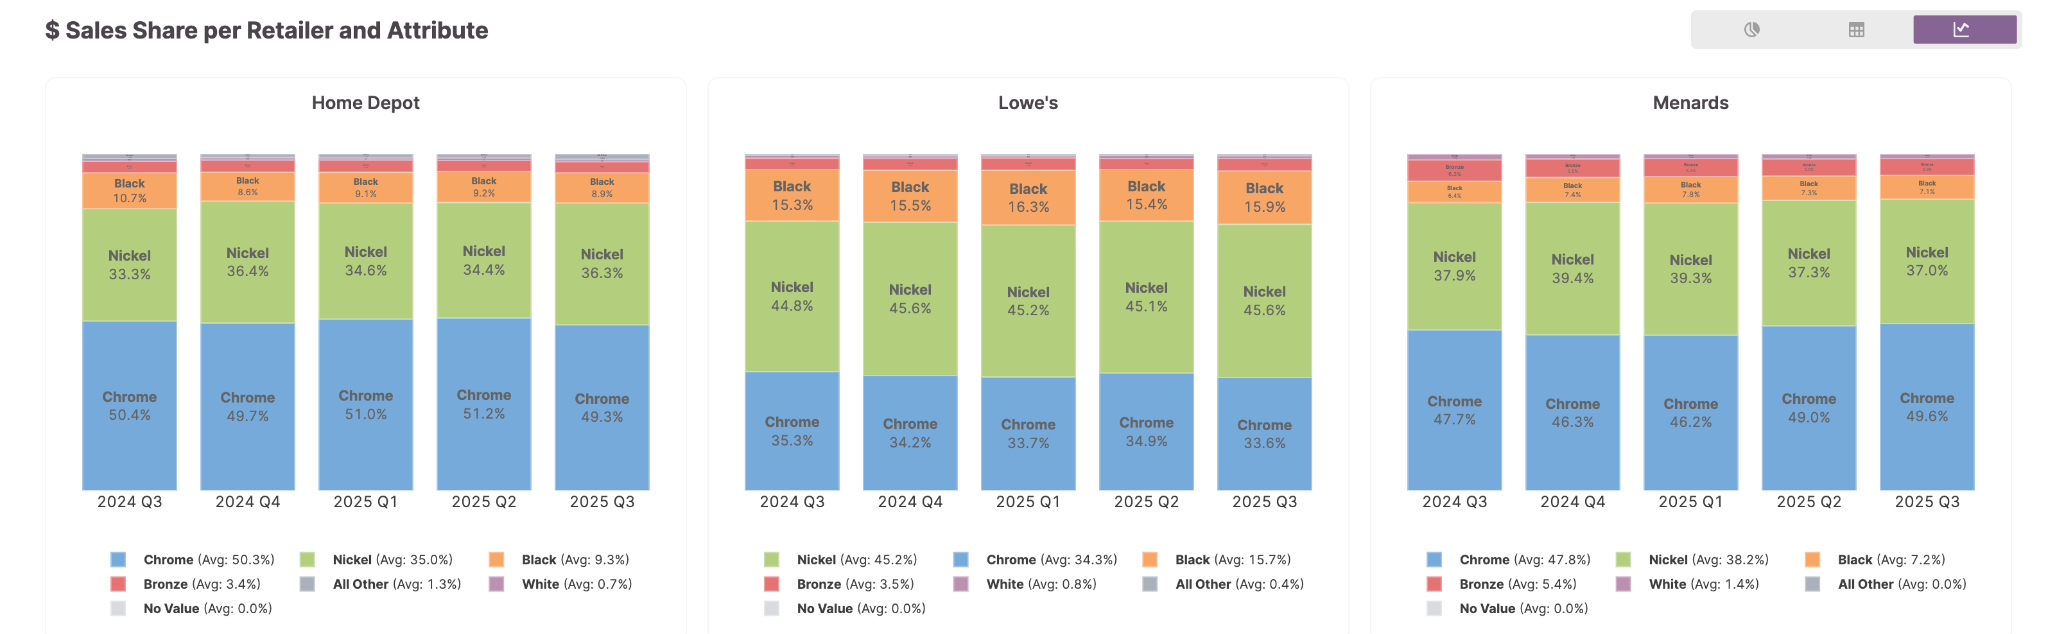
Market Share by Attribute
Attribute Performance Over Time
Using Attribute Trends, we can clearly see Nickel Shower Heads represent the majority of Home Depots market gains as they make up a larger share of sales quarter over quarter.
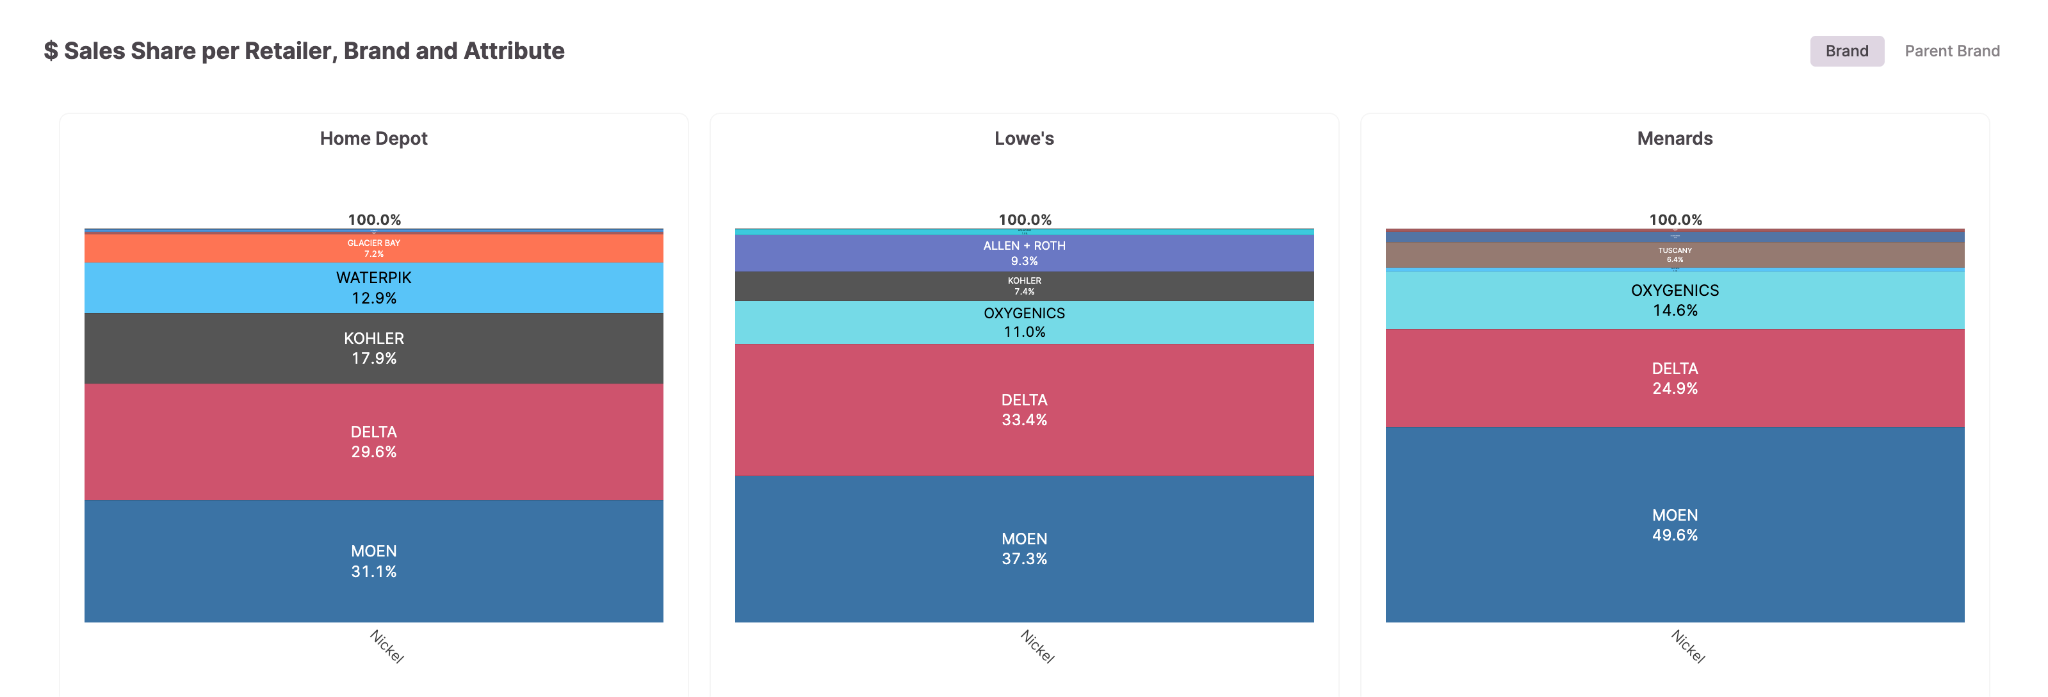
Brand Leadership by Attribute
Next, within that subset of items, identify the leading brands within and across retailers. Moen is the primary supplier across all three major retailers for this color family
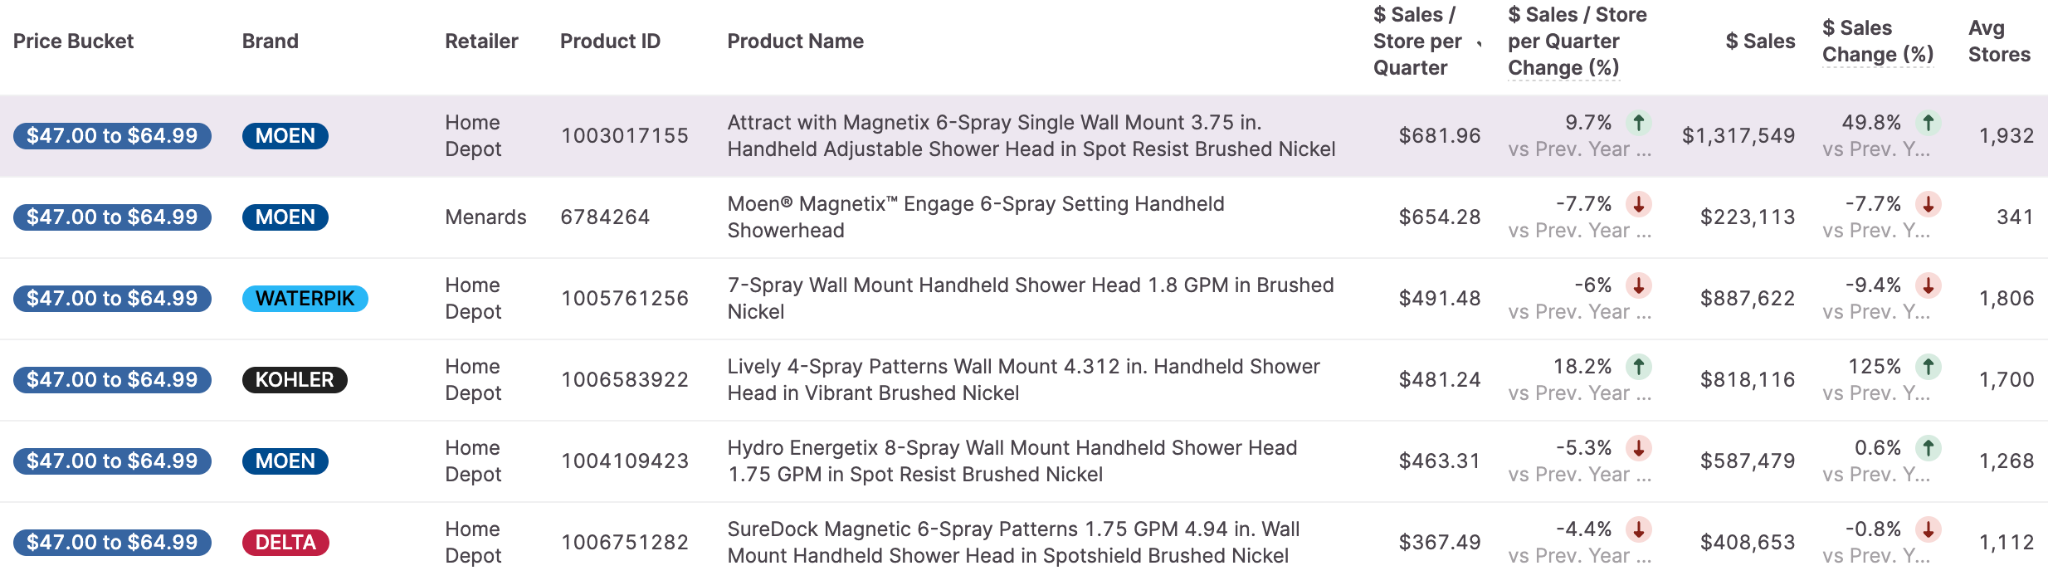
Performance by Attribute & Price Bucket
High Performers
Identify SKUs that are over-performing relative to similar SKUs. This high velocity Nickel Shower head by Moen is seeing high growth relative to LY and is performing the best in its price range on a per store basis.
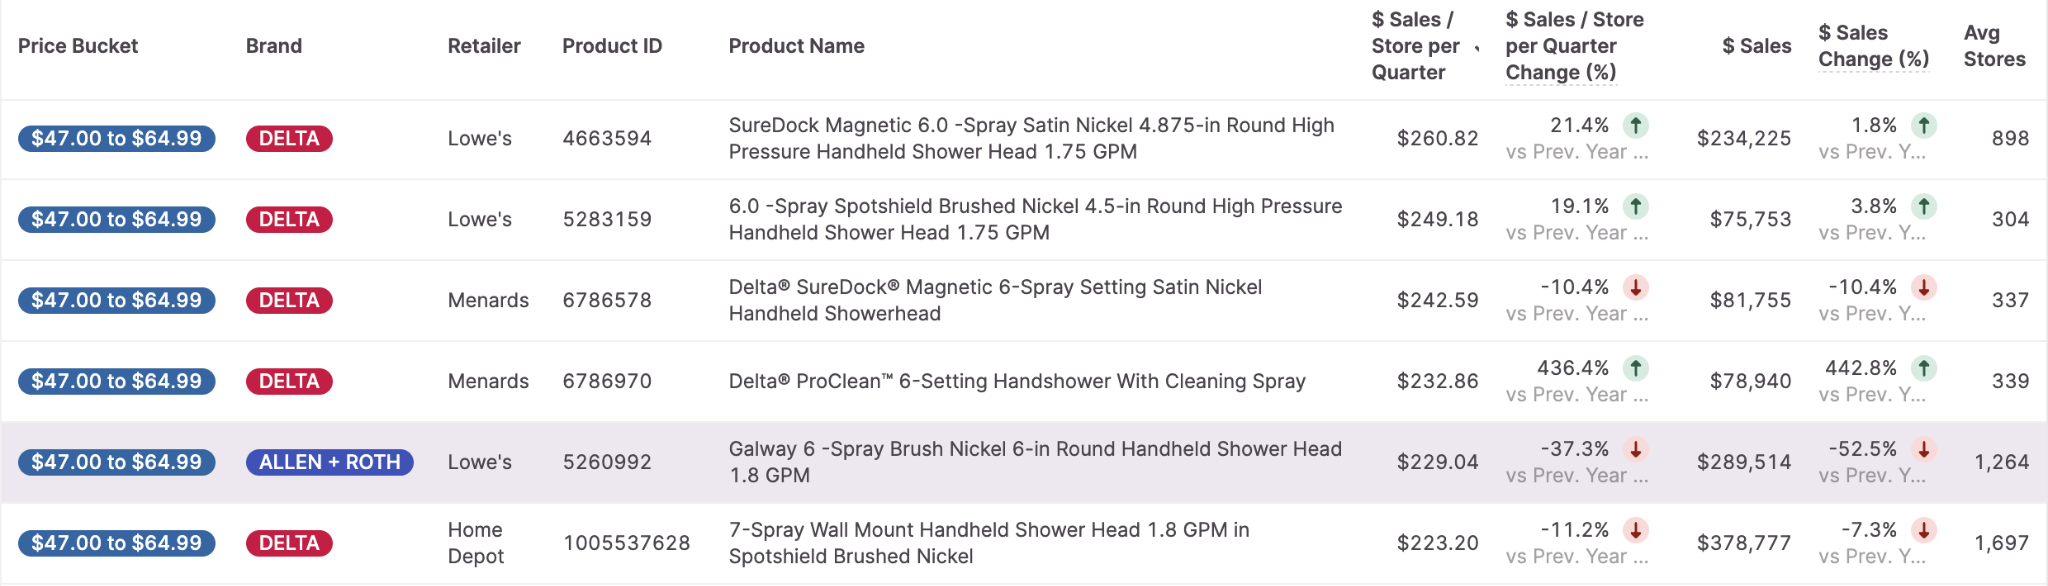
Low Performers
Identify SKUs that are under-performing relative to similar SKUs to find opportunities to swap in your more efficient competitors. This Allen + Roth Nickel Shower Head at Lowes is seeing a weakening performance relative to last year and is much less efficient than the Moen SKU identified above despite being the same color and similar price.
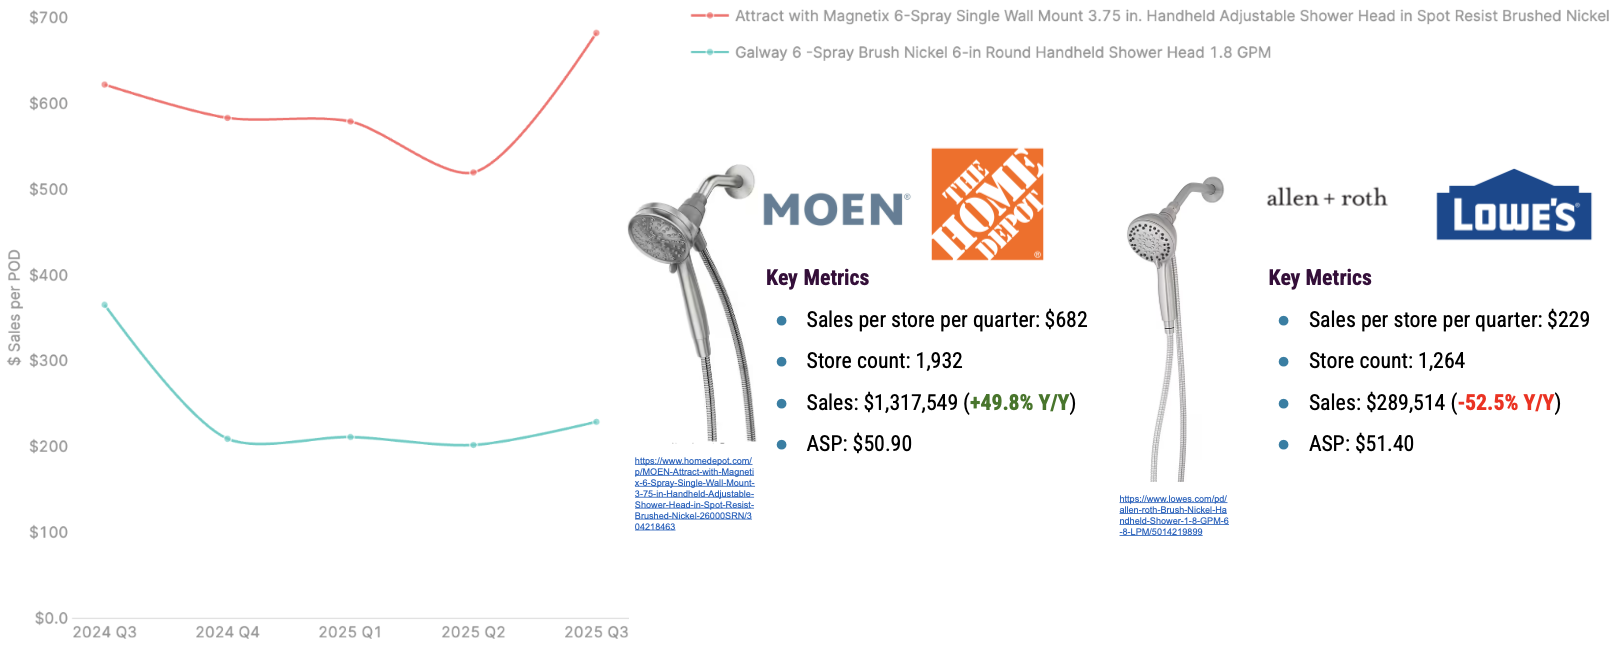
Direct SKU Comparisons - SKU Swaps or Defense
Build detailed SKU-level comparisons to make specific recommendations for swapping under-performing competitive SKUs with your better-performing alternatives. When charted together using Report Builder, Moen has all made a clear case for replacing this less efficient SKU with a more efficient competitor. Lowe'e Estimated Uplift: ($682 - $229) $ sales per store per quarter * 1264 stores = $572,592 per quarter. Note: While a $0.5M opportunity is substantial, you can find additional opportunities by returning to Step 3 and selecting different attribute & price combinations.
Ready to Prepare for Your Own PLR?
Use these steps as a template to build compelling, data-driven assortment recommendations to your retail partners. Download the full deck produced from this workflow by clicking the button below.
Download Full Playbook Deck (PDF)