Inventory Summary
Win orders when competing brands and retailers are out of stock, and know when to slow orders based on market oversupply. Monitor Inventory KPIs across your competitive retailers and brands. Surface competitive stock-outs, weeks on-hand metrics to the retailer's inventory planning teams and merchants.
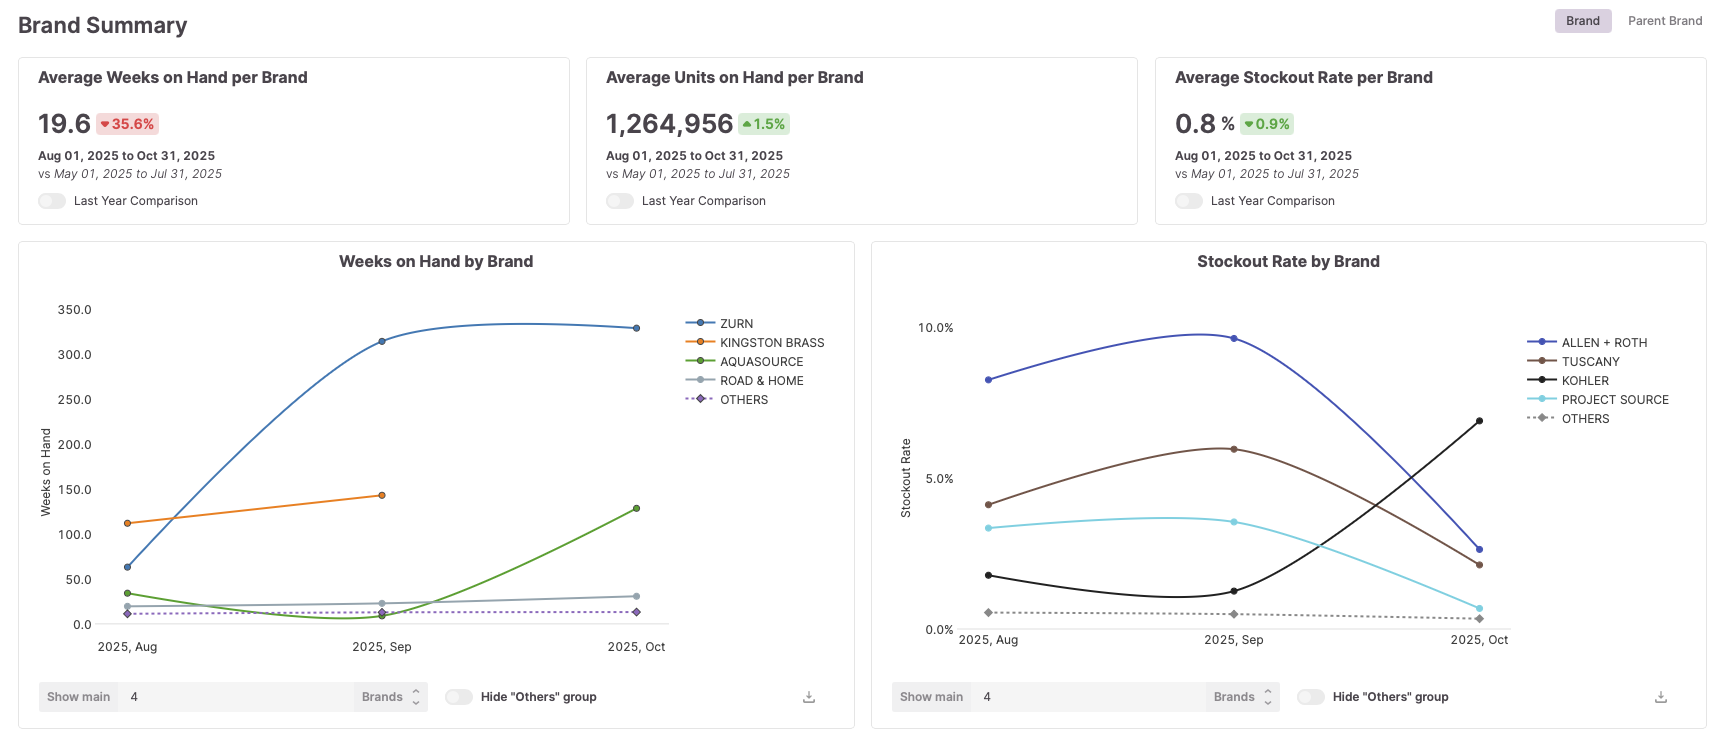
Inventory Summary Basics
How to Read
Monitor inventory levels over time for your category, with trend lines that show inventory health. Line graphs will indicate potential stock-outs, and heat maps will enable simple comparisons across brands, retailers, and states. Compare inventory trends patterns to stay ahead of supply chain trends.
How to Use
Use brand comparisons to show how inventory levels impact your category and identify brands struggling to keep items on the shelf. Switch to the 'State' tab to identify regional supply chain issues for brands and use these insights to strengthen retailer relationships by helping them maintain optimal stock levels through spot buys in areas struggling with supply.
Key Metrics
Brand Stock-Out Rate
The average stock out rate for items within this brand.
Item Stock-Out Rate
The percentage of days this item had 0 inventory in the time period.
Methodology: # of Days with 0 Inventory / Total Days * 100
Weeks of Supply
Number of days current inventory will last at the current sales rate, helping predict when stock-outs might occur.
Methodology: Current Inventory Units / Average Daily Sales
Lost Sales from Stock-Outs
Estimated revenue lost when products are unavailable, quantifying the cost of inventory problems.
Methodology: # of Days with No Inventory * 60D Rolling Average Daily Sales